

All articles
Comparisons / 6 minutes read
CSAT vs NPS vs CES: Complete Comparison Guide (2026)
July 9, 2026
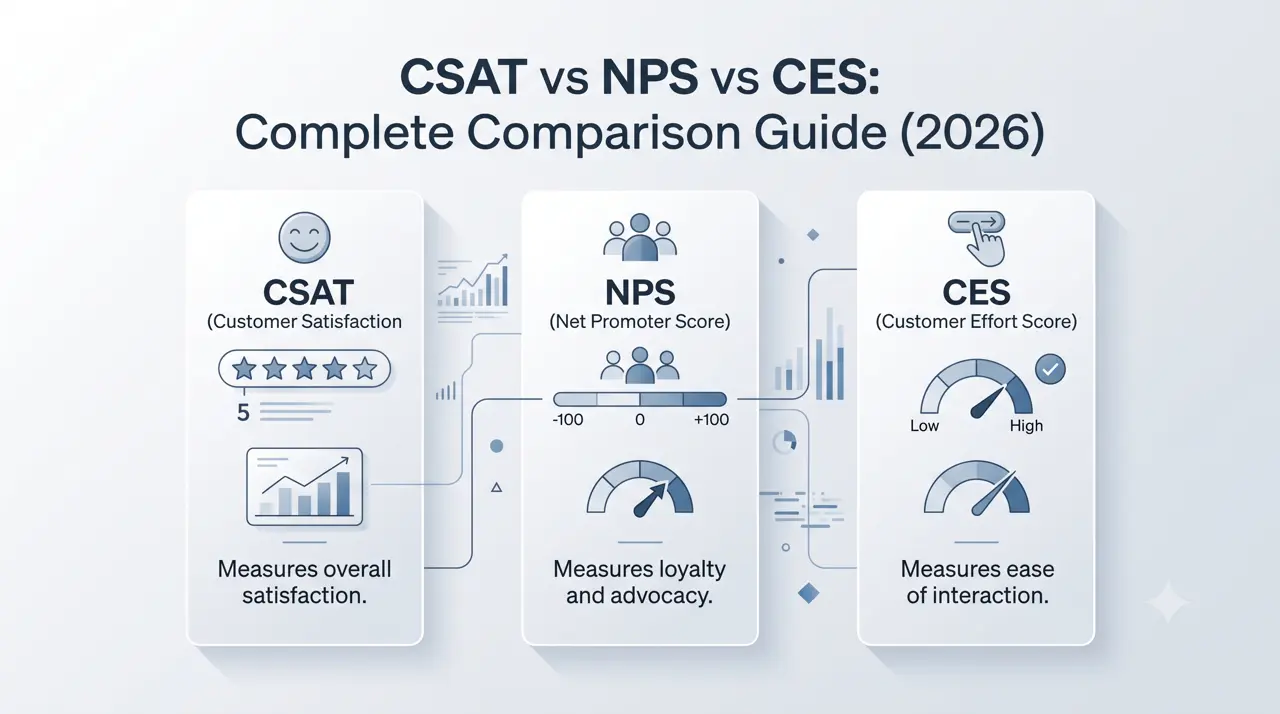
If you’re measuring customer experience (CX), you’ve almost certainly encountered three metrics:
- Customer Satisfaction Score (CSAT)
- Net Promoter Score (NPS)
- Customer Effort Score (CES)
Although they’re often grouped together, these metrics answer completely different business questions.
Many companies make the mistake of relying on only one metric—typically NPS—and assume they understand customer satisfaction. In reality, each metric captures a different stage of the customer journey.
This guide explains:
- What CSAT, NPS, and CES measure
- How each metric is calculated
- Their strengths and weaknesses
- When to use each one
- Why high-performing customer experience teams use all three together
Throughout this article, you’ll also find free calculators to help you measure each metric accurately.
Quick Comparison
Metric
Measures
Best For
Survey Timing
Scale
CSAT
Satisfaction
Individual interactions
Immediately after an event
1–5 or 1–7
NPS
Loyalty
Overall customer relationship
Quarterly or semi-annually
0–10
CES
Customer effort
Ease of completing a task
Right after support or onboarding
1–5 or 1–7
In one sentence:
- CSAT asks: “Were you satisfied?”
- NPS asks: “Would you recommend us?”
- CES asks: “Was this easy?”
What is CSAT?
Customer Satisfaction Score (CSAT) measures how satisfied customers are with a specific interaction, such as:
- A support ticket
- A purchase
- Product onboarding
- Feature usage
- Live chat
- Delivery experience
Typical question:
“How satisfied were you with your experience?”
Customers usually answer using a 5-point or 7-point Likert scale.
CSAT Formula
CSAT = (Satisfied Responses ÷ Total Responses) × 100
If 82 out of 100 customers select either 4 or 5:
CSAT = 82%
👉 Calculate your score instantly:
Advantages of CSAT
- Easy for customers to answer
- High response rates
- Great for transactional feedback
- Helps identify operational issues quickly
Limitations
CSAT measures how customers feel immediately after one interaction.
It doesn’t necessarily predict:
- loyalty
- retention
- renewals
- referrals
A customer can be satisfied with today’s support call but still leave next month.
What is NPS?
Net Promoter Score (NPS) measures customer loyalty and advocacy.
Instead of asking about satisfaction, NPS asks:
“How likely are you to recommend our company to a friend or colleague?”
Customers answer from 0 to 10.
Responses are classified as:
- Promoters: 9–10
- Passives: 7–8
- Detractors: 0–6
NPS Formula
NPS = % Promoters − % Detractors
Example:
- 60% Promoters
- 25% Passives
- 15% Detractors
NPS = 60 − 15 = 45
Possible scores range from −100 to +100.
👉 Try our free calculator:
Advantages of NPS
- Measures long-term customer loyalty
- Easy to benchmark
- Popular across industries
- Correlates with growth in many organizations
Limitations
NPS tells you whether customers are loyal, but not why.
A low NPS doesn’t identify:
- poor onboarding
- confusing UX
- slow customer support
- pricing concerns
You’ll usually need follow-up questions to uncover root causes.
What is CES?
Customer Effort Score (CES) measures how easy it is for customers to accomplish a task.
Example question:
“The company made it easy for me to resolve my issue.”
Customers rate their agreement on a 1–7 scale.
CES Formula
Most modern surveys calculate:
CES = Total Score ÷ Number of Responses
For example:
450 points ÷ 75 responses = 6.0
Higher scores indicate less effort.
Calculate your score here:
Advantages of CES
Excellent for identifying friction during:
- onboarding
- support
- checkout
- account setup
- self-service flows
Research popularized by the former CEB (now Gartner) found that reducing customer effort is a strong predictor of loyalty, especially for service interactions.
Limitations
CES only measures one touchpoint.
It doesn’t reflect:
- brand perception
- emotional attachment
- overall relationship quality
CSAT vs NPS vs CES
CSAT measures satisfaction
Best for:
- customer support
- deliveries
- product releases
- purchases
Question:
“How satisfied were you?”
NPS measures loyalty
Best for:
- quarterly health checks
- subscription businesses
- brand perception
Question:
“Would you recommend us?”
CES measures friction
Best for:
- onboarding
- support
- account setup
- checkout
Question:
“How easy was this?”
Which Metric Should You Use?
The answer depends on your goal.
Your Goal
Best Metric
Measure support quality
CSAT
Measure customer loyalty
NPS
Find friction
CES
Improve onboarding
CES
Benchmark brand perception
NPS
Evaluate a new feature
CSAT
Why Leading CX Teams Use All Three
The strongest Voice of Customer (VoC) programs don’t treat these metrics as competitors—they use them together because each answers a different question:
- NPS tells you whether customers are likely to stay and recommend your brand.
- CSAT shows whether a specific interaction met expectations.
- CES reveals where unnecessary effort or friction exists in the customer journey.
This layered approach helps organizations move beyond simply tracking scores to identifying actionable improvements across the entire customer lifecycle.
A practical framework is:
Journey Stage
Metric
Product onboarding
CES
Customer support
CSAT + CES
Quarterly health survey
NPS
Feature launch
CSAT
Renewal period
NPS
Common Mistakes
Using only NPS
NPS shows loyalty but doesn’t explain the underlying causes of customer sentiment.
Sending surveys too late
Transaction-based surveys should be sent immediately after the experience while it’s still fresh.
Surveying too often
Excessive surveys can reduce response rates and introduce survey fatigue.
Focusing only on scores
The numeric score tells you what happened.
Open-ended comments explain why it happened.
Combining quantitative metrics with qualitative feedback provides much richer insights.
Best Practices
- Keep surveys short.
- Ask only one primary metric per survey.
- Include an optional follow-up question.
- Segment results by customer type.
- Track trends over time rather than relying on a single snapshot.
- Always act on the feedback you collect.
Free Customer Experience Calculators
If you’re measuring customer feedback regularly, these free tools can save time and eliminate manual calculations:
- CSAT Calculator https://www.suggix.com/tools/csat-calculator
- NPS Calculator https://www.suggix.com/tools/nps-calculator
- CES Calculator https://www.suggix.com/tools/ces-calculator
Frequently Asked Questions
Which metric is the most important?
There isn’t a single “best” metric.
- Use CSAT for satisfaction.
- Use NPS for loyalty.
- Use CES for customer effort.
Most mature customer experience programs combine all three.
Can I use all three metrics?
Yes.
Many organizations measure:
- CSAT after support interactions
- CES after onboarding or self-service journeys
- NPS every quarter or every six months
This provides a balanced view of customer experience without over-surveying users.
Is NPS better than CSAT?
Not necessarily.
NPS and CSAT answer different questions:
- NPS predicts long-term loyalty.
- CSAT evaluates short-term satisfaction.
They complement rather than replace each other.
What is a good CES score?
A CES above 5.0 on a 7-point agreement scale is generally considered strong, though acceptable benchmarks vary by industry and survey design. It’s often more valuable to monitor trends over time and compare similar customer journeys than to focus on a universal benchmark.
References
To ensure this guide reflects established customer experience practices, we recommend the following authoritative resources:
- Qualtrics XM Institute – Customer Effort Score guide: https://www.qualtrics.com/articles/customer-experience/customer-effort-score/
- Harvard Business Review – Stop Trying to Delight Your Customers: https://hbr.org/2010/07/stop-trying-to-delight-your-customers
- Gartner – Customer Experience research: https://www.gartner.com/en/customer-service-support
- What Is Net Promoter Score (NPS)? Definition, Formula, and Examples: https://www.suggix.com/blog/what-is-net-promoter-score-nps-definition-formula-and-examples
Build what users love, together
Collect feedback, prioritize features, and keep your roadmap aligned with what actually matters.
Get Started — It’s FreeNo credit card required · 14-day free trial · Setup in minutes